0
我正在使用qml应用程序处理我的pyqt5,并且想要将地图网格添加到我的地图。但我有点不知道从哪里开始。那么,甚至有可能做出一个,如果是的话,是否有一个小例子或类似的东西来帮助我开始研究?这将是我的map.qml。是否可以在qml中创建地图网格?
import QtQuick 2.0
import QtQuick.Controls 2.2
import QtQuick.Window 2.0
import QtLocation 5.9
import QtPositioning 5.5


Item {
id: myItem

Plugin {
    id: mapPlugin
    name: "mapboxgl"
}

Map {
    id: map
    objectName: "mapboxgl"
    property double lat: 47.368649
    property double lon: 8.5391825
    visible: true
    anchors.fill: parent
    plugin: mapPlugin
    center {
     latitude: lat
     longitude: lon
    }
    zoomLevel: 14

    ListView {
     height: 1
     model: map
     delegate: Text {
      text: "Latitude: " + (center.latitude).toFixed(3) + " Longitude: " + (center.longitude).toFixed(3)
      }
     }

     MouseArea{
      id: mouseArea
      property var positionRoot: map.toCoordinate(Qt.point(mouseX, mouseY))
      anchors.fill: parent
      onClicked: {
        var component = Qt.createComponent("addAttribute.qml")
        if (component.status === Component.Ready) {
        var dialog = component.createObject(parent,{popupType: 1})
        dialog.sqlPosition = positionRoot
        dialog.show()
       }
      }
     }

    MapQuickItem {
     id: marker
     objectName: "marker"
     visible: false
     anchorPoint.x: 0.5 * image.width
     anchorPoint.y: image.height
     sourceItem: Image {
      id: image
      source: "icons/markerIcon.png"
      MouseArea{
       anchors.fill: parent
       onClicked: {
        ToolTip.timeout = 2000
        ToolTip.visible = true
        ToolTip.text = qsTr("Coordinates: %1, %2").arg(marker.coordinate.latitude).arg(marker.coordinate.longitude)
       }
      }
     }
    }

    MapItemView {
     model: markerModel
     delegate: MapQuickItem{
      anchorPoint: Qt.point(2.5, 2.5)
      coordinate: QtPositioning.coordinate(markerPosition.x, markerPosition.y)
      zoomLevel: 0
      sourceItem: Column{
        Image {
         id: imag
         source: "icons/markerIcon.png"
         MouseArea{
          anchors.fill: parent
          onClicked: {

           ToolTip.timeout = 2000
           ToolTip.visible = true
           ToolTip.text = qsTr("Coordinates: %1, %2".arg(markerPosition.x).arg(markerPosition.y))
          }
         }
        }

        Text {
         text: markerTitle
         font.bold: true
        }
      }
     }
    }
    MapParameter {
    type: "source"
    property var name: "coordinates"
    property var sourceType: "geojson"
    property var data: '{ "type": "FeatureCollection", "features": \
     [{ "type": "Feature", "properties": {}, "geometry": { \
     "type": "LineString", "coordinates": [[ 8.541484, \
     47.366850 ], [8.542171, 47.370018],[8.545561, 47.369233]]}}]}'
    }

    MapParameter {
     type: "layer"
     property var name: "layer"
     property var layerType: "line"
     property var source: "coordinates"
     property var before: "road-label-small"
    }

    MapParameter {
     objectName: "paint"
     type: "paint"
     property var layer: "layer"
     property var lineColor: "black"
     property var lineWidth: 8.0
    }

    MapParameter {
     type: "layout"
     property var layer: "layer"
     property var lineJoin: "round"
     property var lineCap: "round"
    }
}
}
该网格可能看起来像这样。 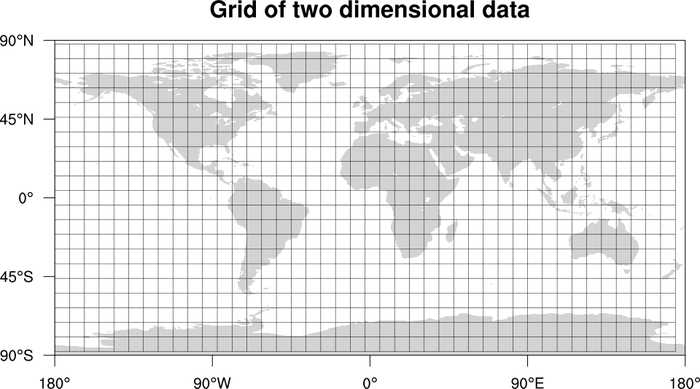

答案是:或许是肯定的。要删除可能,我们需要更多的信息。你能否提供一些*你已经*的代码,并且更详细地解释你喜欢什么样的*地图网格?也许你可以添加一些图片来说明它现在的样子,以及它应该如何看待。 (*另外还有一个更详细的功能描述*) – derM
我已经添加了我的'qml'代码以及网格如何显示的图像。目前我没有电网,因为我不知道如何制作电网。这就是为什么我的网格没有任何图像。 – Blinxen