0
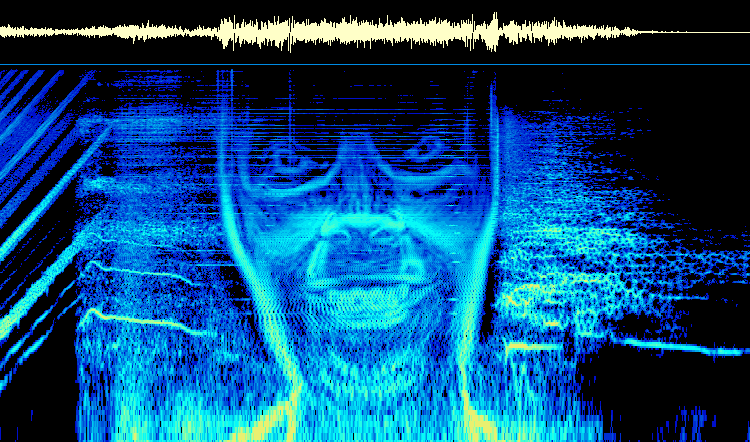
我有一个图像编码成一些.wav文件的频谱的问题,这样的结果与此类似:http://www.bastwood.com/projects/aphex_face/aphex.png如何在python中对频谱中的图像进行编码?
我刚开始接触编程,所以我在寻找很容易理解解决方案
有人可以帮忙吗?
我有一个图像编码成一些.wav文件的频谱的问题,这样的结果与此类似:http://www.bastwood.com/projects/aphex_face/aphex.png如何在python中对频谱中的图像进行编码?
我刚开始接触编程,所以我在寻找很容易理解解决方案
有人可以帮忙吗?
为了将图像编码成波谱,您可以使用下面从GitHub下载的程序。 频谱图python代码将图像转换为音频波形文件。
#!/usr/bin/python
import numpy as np
import matplotlib.image as mpimg
import wave
from array import array


def make_wav(image_filename):
    """ Make a WAV file having a spectrogram resembling an image """
    # Load image
    image = mpimg.imread(image_filename)
    image = np.sum(image, axis = 2).T[:, ::-1]
    image = image**3 # ???
    w, h = image.shape

    # Fourier transform, normalize, remove DC bias
    data = np.fft.irfft(image, h*2, axis=1).reshape((w*h*2))
    data -= np.average(data)
    data *= (2**15-1.)/np.amax(data)
    data = array("h", np.int_(data)).tostring()

    # Write to disk
    output_file = wave.open(image_filename+".wav", "w")
    output_file.setparams((1, 2, 44100, 0, "NONE", "not compressed"))
    output_file.writeframes(data)
    output_file.close()
    print "Wrote %s.wav" % image_filename


if __name__ == "__main__":

    my_image = "spectrogram.png"
    make_wav(my_image)
为了将波形文件显示为光谱图,您有几个选择。根据您的平台,您可以下载sox和运行
sox <yourImage>.jpg.wav -n spectrogram
SOX,短声音交流会则图像的音频波形文件转换为图像谱图。 
或者如果您不想下载SOX,您可以使用以下程序创建图像音频波形文件的频谱图。
#!/usr/bin/env python
#coding: utf-8
""" This work is licensed under a Creative Commons Attribution 3.0 Unported License.
    Frank Zalkow, 2012-2013 """

import numpy as np
from matplotlib import pyplot as plt
import scipy.io.wavfile as wav
from numpy.lib import stride_tricks

""" short time fourier transform of audio signal """
def stft(sig, frameSize, overlapFac=0.5, window=np.hanning):
    win = window(frameSize)
    hopSize = int(frameSize - np.floor(overlapFac * frameSize))

    # zeros at beginning (thus center of 1st window should be for sample nr. 0)
    samples = np.append(np.zeros(np.floor(frameSize/2.0)), sig)
    # cols for windowing
    cols = np.ceil((len(samples) - frameSize)/float(hopSize)) + 1
    # zeros at end (thus samples can be fully covered by frames)
    samples = np.append(samples, np.zeros(frameSize))

    frames = stride_tricks.as_strided(samples, shape=(cols, frameSize), strides=(samples.strides[0]*hopSize, samples.strides[0])).copy()
    frames *= win

    return np.fft.rfft(frames)

""" scale frequency axis logarithmically """
def logscale_spec(spec, sr=44100, factor=20.):
    timebins, freqbins = np.shape(spec)

    scale = np.linspace(0, 1, freqbins) ** factor
    scale *= (freqbins-1)/max(scale)
    scale = np.unique(np.round(scale))

    # create spectrogram with new freq bins
    newspec = np.complex128(np.zeros([timebins, len(scale)]))
    for i in range(0, len(scale)):
     if i == len(scale)-1:
      newspec[:,i] = np.sum(spec[:,scale[i]:], axis=1)
     else:
      newspec[:,i] = np.sum(spec[:,scale[i]:scale[i+1]], axis=1)

    # list center freq of bins
    allfreqs = np.abs(np.fft.fftfreq(freqbins*2, 1./sr)[:freqbins+1])
    freqs = []
    for i in range(0, len(scale)):
     if i == len(scale)-1:
      freqs += [np.mean(allfreqs[scale[i]:])]
     else:
      freqs += [np.mean(allfreqs[scale[i]:scale[i+1]])]
    return newspec, freqs

""" plot spectrogram"""
def plotstft(audiopath, binsize=2**10, plotpath=None, colormap="jet"):
    samplerate, samples = wav.read(audiopath)
    s = stft(samples, binsize)

    sshow, freq = logscale_spec(s, factor=1.0, sr=samplerate)
    ims = 20.*np.log10(np.abs(sshow)/10e-6) # amplitude to decibel

    timebins, freqbins = np.shape(ims)

    plt.figure(figsize=(15, 7.5))
    plt.imshow(np.transpose(ims), origin="lower", aspect="auto", cmap=colormap, interpolation="none")
    plt.colorbar()

    plt.xlabel("time (s)")
    plt.ylabel("frequency (hz)")
    plt.xlim([0, timebins-1])
    plt.ylim([0, freqbins])

    xlocs = np.float32(np.linspace(0, timebins-1, 5))
    plt.xticks(xlocs, ["%.02f" % l for l in ((xlocs*len(samples)/timebins)+(0.5*binsize))/samplerate])
    ylocs = np.int16(np.round(np.linspace(0, freqbins-1, 10)))
    plt.yticks(ylocs, ["%.02f" % freq[i] for i in ylocs])

    if plotpath:
     plt.savefig(plotpath, bbox_inches="tight")
    else:
     plt.show()

    plt.clf()

plotstft("spectrogram.png.wav")
#
图片谱图如下:

你可能想与内'SOX'不同的设置来发挥,也谱图生成Python代码[第二方案]给你在色彩方面预期效果,决议和偏见。 –