16
我只是想为ggplot2生成的每个数字面板添加注释; (a),(b),(c)等简单的标签。有没有简单的方法来做到这一点?ggplot2:geom_text()with facet_grid()?
我只是想为ggplot2生成的每个数字面板添加注释; (a),(b),(c)等简单的标签。有没有简单的方法来做到这一点?ggplot2:geom_text()with facet_grid()?
来源:https://groups.google.com/forum/?fromgroups=#!topic/ggplot2/RL8M7Ut5EpU您可以使用以下方法:
library(ggplot2)
x <-runif(9, 0, 125)
data <- as.data.frame(x)
data$y <- runif(9, 0, 125)
data$yy <- factor(c("a","b","c"))

ggplot(data, aes(x, y)) +
    geom_point(shape = 2) +
    facet_grid(~yy) +
    geom_text(aes(x, y, label=lab),
     data=data.frame(x=60, y=Inf, lab=c("this","is","the way"),
      yy=letters[1:3]), vjust=1)
这应该给你:
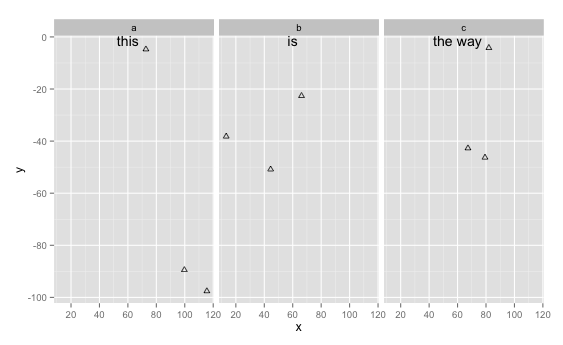
+1,但是你能否提供更多的上下文来了解它的工作原理?现在它只是一段代码和一张图片。 – 2013-04-07 20:30:09
当然。基础'ggplot'调用具有数据框和'geom_point''facet_grid'构面的实际绘图数据。关键是为'geom_text'设置一个新的数据框(在代码片段中动态创建,但可以在'ggplot'块外部创建并引用数据框),并将标签元素的数量与方面的数量。您可以对'geom_text'使用多次调用,以在各个构面之间放置多个不同的标签。他们会被依次引用,所以要注意这一点。 – hrbrmstr 2013-04-07 20:53:12
如果您想要绘制多个标签,则不需要多次调用geom_text,只需将行添加到具有适当文本和facet_grid变量的data.frame。 – 2013-04-07 21:06:20
基本上,您将创建一个data.frame,其中包含带文本的列的文本以及包含用于facet_grid的变量的列。然后,您可以简单地将geom_text与data.frame相加。请参阅geom_text的文档以获取关于文本放置等的更多详细信息。
你有一个图片作为一个例子,你可以发布? – 2013-04-07 20:14:22
对不起,我需要弄清楚如何发布图片... – hatmatrix 2013-04-07 22:02:29